
Quantitative descriptive research is one of the most widely used research approaches today. It helps organisations understand what is happening in a population using clear numbers, structured methods, and objective measurements. Whether you are studying customers, patients, students, employees, or any large group, descriptive research gives you a simple and accurate picture of patterns, trends, and behaviours.
Among the many types of quantitative research, quantitative descriptive research is often the first step. It answers “what is happening” before you move to deeper causal or experimental designs.
From public health to education, from social development to market studies, descriptive quantitative methods help researchers answer questions without guessing. They measure facts, not opinions. As a global quantitative market research company, Insights Opinion supports teams with structured surveys, descriptive statistics, validated tools, and complete quantitative data analysis services.
In this blog, we explore the characteristics, methods, and descriptive quantitative research examples that make this approach essential for data-driven teams.
Understanding Quantitative Descriptive Research

Quantitative descriptive research methods is a non-experimental research design used to describe the characteristics of a population using numerical data. It focuses on “what exists” rather than “why it exists.” This method does not try to test causality or manipulate variables. Instead, it uses measurable, objective and precise observations to present a factual view of a group.
It follows a quantitative approach and a descriptive approach, making it ideal for studies where the goal is to summarise, compare, and document real-world conditions using validated tools, structured formats, and consistent data collection.
Key Characteristics Of Quantitative Descriptive Research
Before we understand methods and examples, it is important to know what makes quantitative descriptive research unique. These characteristics define how it measures real-world conditions with accuracy and consistency.
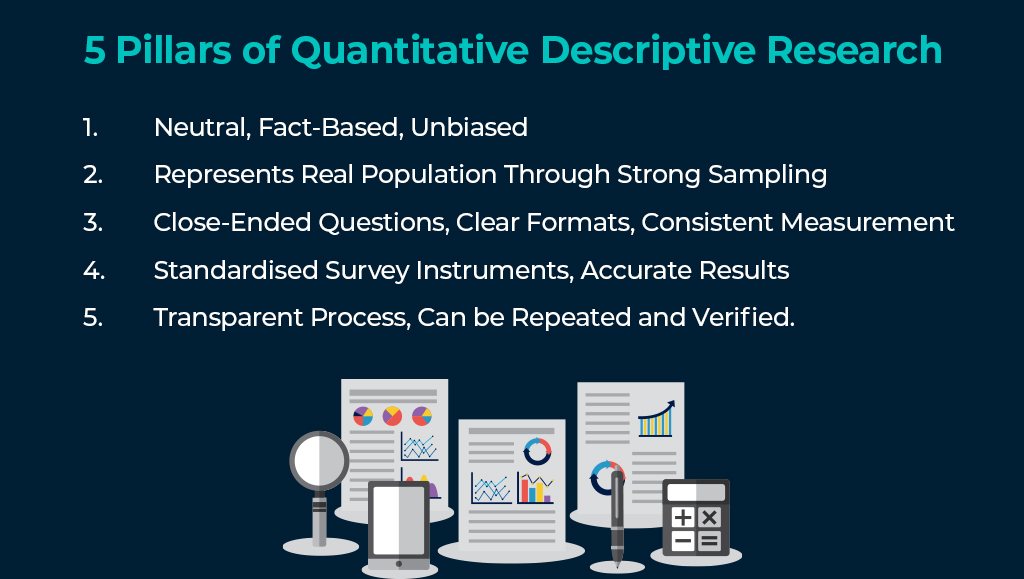
#1 – Objectivity And Non-Bias
Descriptive quantitative research relies on objectivity, reducing personal influence and ensuring non-bias in results. Standard questions, fixed options, and clear instructions help keep the data neutral and fair.
#2 – Large Sample Size And Population Coverage
A strong sample size improves accuracy and supports generalizability. Researchers use random sampling, stratified sampling, convenience sampling, or systematic sampling to select a group that represents the full population.
#3 – Structured And Close-Ended Design
This method uses structured questionnaires with close-ended questions. These formats allow researchers to capture frequencies, percentages, and other metrics with consistency.
#4 – Reliable And Valid Measurements
Descriptive research focuses on reliability and validity of tools. Every measurement must be accurate, consistent, and based on validated tools like standardised survey instruments.
#5 – Replicability And Research Transparency
Because the process is clear and documented, descriptive research offers strong replicability. Other researchers can repeat the same study and verify the results.
Common Methods Used In Quantitative Descriptive Research
Quantitative descriptive research uses simple, non-experimental techniques to gather measurable information from large groups. These methods help researchers understand what is happening without influencing the situation.
#1 – Surveys And Questionnaires
The most common method involves structured surveys and questionnaires with fixed options. Researchers use metrics like frequency, percentage, mean, mode, median, standard deviation, and variance to summarise the data.
#2 – Observational And Cross-Sectional Studies
Researchers may conduct observational studies, cross-sectional studies, or longitudinal research. These methods are non-experimental, so they do not manipulate variables. They simply record what is happening in real environments.
#3 – Secondary Data And Document Analysis
Researchers may analyse existing data, such as public datasets or internal company reports. This includes content analysis, reports, documents, and large databases.
For each method, the data collection process includes data cleaning, data coding, data entry, and the use of tools like computer software for processing.
Data Analysis Techniques In Quantitative Descriptive Research
After data is collected, quantitative descriptive studies use simple yet powerful numerical techniques to summarise, compare, and interpret results.
-
Descriptive Statistics For Clear Summaries
Researchers summarise data using descriptive statistics including:
- Mean,
- Median,
- Mode,
- Standard deviation,
- Variance,
- Frequency distribution.
These metrics provide a data summary that explains trends and overall patterns.
-
Pattern And Trend Identification
Descriptive analysis is ideal for spotting patterns, trends, and distribution of responses. Researchers compare baseline numbers, use comparative analysis, and evaluate variables across groups.
-
Data Visualization For Simple Understanding
Data is presented using graphs, charts, tables, and diagrams. These visuals make complex information easy to interpret and improve data clarity for stakeholders.
-
Statistical Tools And Software
Modern descriptive research uses statistical tools, computer software, and analytical programs for:
- Correlation,
- Association detection,
- Cross-tabulation,
- Descriptive modeling.
These support deeper data interpretation and strong research documentation.
Descriptive Quantitative Research Examples
Here are real, published examples that show how quantitative descriptive research methods are used across health, education, business, and social science.
-
Healthcare Example: Patient Satisfaction In Bhutan’s Regional Hospitals
A 2025 study in PLOS ONE examined patient satisfaction in two regional referral hospitals in Bhutan. The goal was to understand how satisfied patients were with hospital care and which factors shaped their experience.
Researchers used a comparative cross-sectional design and analysed archived patient satisfaction surveys from 431 patients treated at Mongar Eastern Regional Referral Hospital and Gelephu Central Regional Referral Hospital. The surveys used an adapted version of the Patient Satisfaction Questionnaire-18 with a 5-point Likert scale.
The study reported an overall mean satisfaction score of 4.06 out of 5, which indicates generally high satisfaction. Financial aspects of care scored the highest, while accessibility and convenience scored the lowest. The researchers also used descriptive statistics and regression models to explore how age, patient type, and other socio-demographic factors related to satisfaction, and they identified predictors that hospitals could target for improvement.
This is a clear example of quantitative descriptive research: it uses structured questionnaires, numerical scores, and statistical summaries to describe “what satisfaction looks like” in a defined hospital population, without changing any treatment or running experiments.
-
Education Example: Student Performance And Exam Format In A US University
A 2017 paper in the Journal of Instructional Pedagogies studied how different exam formats relate to student performance in a US higher education institution. The main question was simple: do standard written exams predict how well students will do on practical, hands-on exams?
The researchers used a quantitative, correlational design and analysed exam scores from 247 undergraduate students across two technology-related courses over three academic years. Each student took both a standard midterm exam and a practical exam. All the data were numerical test scores recorded in a structured database.
Using descriptive statistics and linear regression analysis, the study found that scores on standard written exams were not strong predictors of scores on practical exams. This suggested that the two exam types were measuring different skill sets, and that relying only on one exam style would give an incomplete picture of student ability.
This example shows how descriptive quantitative research can summarise performance patterns, explore relationships between variables, and support evidence-based changes in assessment design, all using existing numerical data and structured analysis.
-
Business Example: Customer Satisfaction In Islamic And Conventional Banks
In 2017, a study published in the International Review of Management and Marketing compared customer satisfaction between Islamic and conventional banks in Saudi Arabia. The aim was to see whether customers rated their experiences differently across bank types and regions.
Researchers collected data from 596 banking customers across four Saudi cities using a structured questionnaire with a 5-point Likert scale. Customer satisfaction was measured across four main dimensions: safety and security, dealing and attendance, overall satisfaction, and physical aspects of the banks.
They used descriptive statistics (means, standard deviations) and independent-samples t-tests to compare satisfaction scores between Islamic and conventional banks, and across regions. The study found that average satisfaction was similar overall (mean around 3.79 out of 5 for both bank types), but there were meaningful differences at the level of specific service dimensions and regions.
This is a strong business-focused descriptive quantitative example: it uses numerical survey data, large samples, and structured comparisons to describe how satisfied customers are with different banking models, without manipulating any conditions.
Quantitative Market Research Services At Insights Opinion
Insights Opinion is one of the leading quantitative market research companies, delivering end-to-end support for descriptive, analytical, and predictive studies. Our quantitative market research services and quantitative data analysis services help organisations understand behaviour at scale.
We specialise in:
- Large-Scale Sampling – Random, stratified, systematic and convenience sampling for accurate representation.
- Validated Survey Instruments – Structured surveys, questionnaires, observational tools and digital data collection instruments.
- Strong Analytical Frameworks – Descriptive statistics, correlations, cross-tabulation, and advanced modelling using professional software.
- High Data Quality – Every step follows strong research validity, ethical considerations, and strict documentation.
- Sector Coverage – We deliver descriptive studies across business, social research, health research, and education research.
Insights Opinion ensures every dataset is structured, precise, and ready to support evidence-based decisions.
Book Quantitative Market Research With Insights Opinion Now!
Quantitative descriptive research helps you understand “what is happening” with clarity and confidence. It uses structured tools, validated methods and accurate numerical data to show real patterns, trends and distributions in your audience.
Insights Opinion helps organisations run strong descriptive studies with expert sampling, validated questionnaires, precise data collection and clear reporting.
Ready to run a high-quality quantitative research project? Contact our team now:
US: +1 646 475 7865
UK: +44 20 3239 5786
India: +91 120 359 4799
Email: bids@insightsopinion.com
Share your project needs, and our experts will design a descriptive research plan that delivers dependable numbers and actionable insights.
Frequently Asked Questions
What is quantitative descriptive research?
Quantitative descriptive research is a non-experimental method that describes a population using numerical data, structured surveys and statistical summaries.
When should descriptive quantitative methods be used?
Use descriptive quantitative research methods when you need to measure trends, frequencies, averages, or patterns without testing cause-and-effect relationships.
What are the most common descriptive research tools?
Structured surveys, questionnaires, observational checklists, and secondary datasets are a few of the most used descriptive research tools.
Can descriptive research identify trends?
Yes, descriptive research identifies patterns, distribution changes and behaviour trends across groups and time periods.
What is the main limitation of descriptive research?
Descriptive research cannot explain causality, since no variables are manipulated.
How do quantitative market research companies support this method?
Quantitative market research companies provide sampling, survey design, fieldwork, data cleaning, descriptive statistics and reporting.


